Datei:Kalifornien Luftdruck 2050hPa.jpg: Unterschied zwischen den Versionen
Aus Klimawandel
(Luftdruckverteilung der 18 trockensten Winter 1950-2012 in 250 hPa ==Lizenzhinweis== {| style="border:1px solid #8888aa; background-color:#f7f8ff;padding:5px;font-size:95%;" | Quelle: Lin, Y.-H., L.E. Hipps, S.-Y.S. Wang, and J.-H. Yoon (2017): Empiri…) |
K (→Lizenzhinweis) |
||
| Zeile 4: | Zeile 4: | ||
| | | | ||
Quelle: Lin, Y.-H., L.E. Hipps, S.-Y.S. Wang, and J.-H. Yoon (2017): Empirical and modeling analyses of the circulation influences on California precipitation deficits, Atmos. Sci. Let. 18: 19–28, DOI: 10.1002/asl.719<br> | Quelle: Lin, Y.-H., L.E. Hipps, S.-Y.S. Wang, and J.-H. Yoon (2017): Empirical and modeling analyses of the circulation influences on California precipitation deficits, Atmos. Sci. Let. 18: 19–28, DOI: 10.1002/asl.719<br> | ||
Lizenz: CC BY | Lizenz: [https://creativecommons.org/licenses/by/4.0/ CC BY] | ||
|} | |} | ||
Aktuelle Version vom 5. Dezember 2019, 18:17 Uhr
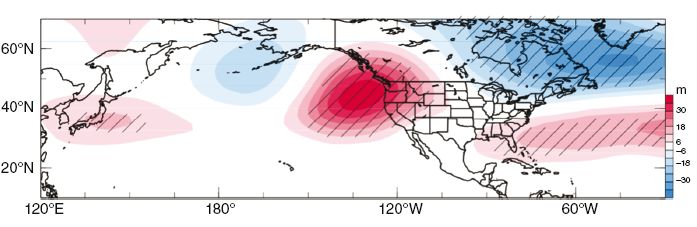
Luftdruckverteilung der 18 trockensten Winter 1950-2012 in 250 hPa
Lizenzhinweis
|
Quelle: Lin, Y.-H., L.E. Hipps, S.-Y.S. Wang, and J.-H. Yoon (2017): Empirical and modeling analyses of the circulation influences on California precipitation deficits, Atmos. Sci. Let. 18: 19–28, DOI: 10.1002/asl.719 |
Dateiversionen
Klicken Sie auf einen Zeitpunkt, um diese Version zu laden.
| Version vom | Vorschaubild | Maße | Benutzer | Kommentar | |
|---|---|---|---|---|---|
| aktuell | 17:46, 29. Dez. 2017 | 697 × 227 (32 KB) | Dieter Kasang (Diskussion | Beiträge) | Luftdruckverteilung der 18 trockensten Winter 1950-2012 in 250 hPa ==Lizenzhinweis== {| style="border:1px solid #8888aa; background-color:#f7f8ff;padding:5px;font-size:95%;" | Quelle: Lin, Y.-H., L.E. Hipps, S.-Y.S. Wang, and J.-H. Yoon (2017): Empiri… |
Sie können diese Datei nicht überschreiben.
Dateiverwendung
Die folgende Seite verwendet diese Datei: