Datei:Ozean temp trend zonal.jpg: Unterschied zwischen den Versionen
(Mittlere zonale Temperaturveränderung 1971-2010 in °C pro Jahrzehnt; schwarze Linien: zonale Mitteltemperaturen in °C ==Lizenzhinweis== {| style="border:1px solid #8888aa; background-color:#f7f8ff;padding:5px;font-size:95%;" | Quelle: IPCC (2013): C…) |
Keine Bearbeitungszusammenfassung |
||
| Zeile 3: | Zeile 3: | ||
{| style="border:1px solid #8888aa; background-color:#f7f8ff;padding:5px;font-size:95%;" | {| style="border:1px solid #8888aa; background-color:#f7f8ff;padding:5px;font-size:95%;" | ||
| | | | ||
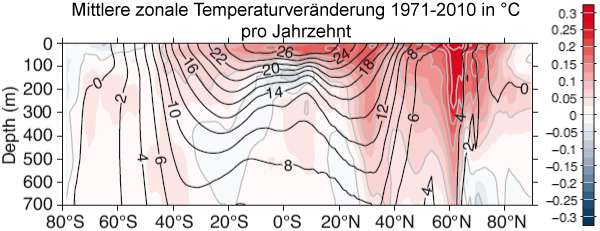
Quelle: IPCC (2013): Climate Change 2013, Working Group I: The Science of Climate Change, Figure 3.1 (b) | Quelle: IPCC (2013): Climate Change 2013, Working Group I: The Science of Climate Change, Figure 3.1 (b)<br> | ||
Lizenz: [https://www.ipcc.ch/home_copyright.shtml Lizenzbestimmung des IPCC]: Reproduction of limited number of figures or short excerpts of IPCC material is authorized free of charge and without formal written permission provided that the original source is properly acknowledged, with mention of the complete name of the report, the publisher and the numbering of the page(s) or the figure(s). Permission can only be granted to use the material exactly as it is in the report. | |||
|} | |} | ||
Aktuelle Version vom 24. September 2018, 09:55 Uhr
Mittlere zonale Temperaturveränderung 1971-2010 in °C pro Jahrzehnt; schwarze Linien: zonale Mitteltemperaturen in °C
Lizenzhinweis
|
Quelle: IPCC (2013): Climate Change 2013, Working Group I: The Science of Climate Change, Figure 3.1 (b) |
Dateiversionen
Klicken Sie auf einen Zeitpunkt, um diese Version zu laden.
| Version vom | Vorschaubild | Maße | Benutzer | Kommentar | |
|---|---|---|---|---|---|
| aktuell | 20:47, 21. Jun. 2015 | 600 × 231 (114 KB) | Dieter Kasang (Diskussion | Beiträge) | Mittlere zonale Temperaturveränderung 1971-2010 in °C pro Jahrzehnt; schwarze Linien: zonale Mitteltemperaturen in °C ==Lizenzhinweis== {| style="border:1px solid #8888aa; background-color:#f7f8ff;padding:5px;font-size:95%;" | Quelle: IPCC (2013): C… |
Sie können diese Datei nicht überschreiben.
Dateiverwendung
Die folgenden 2 Seiten verwenden diese Datei: