Datei:AR6 SSP temp2100.jpg
Originaldatei (1.062 × 516 Pixel, Dateigröße: 46 KB, MIME-Typ: image/jpeg)
Beschreibung
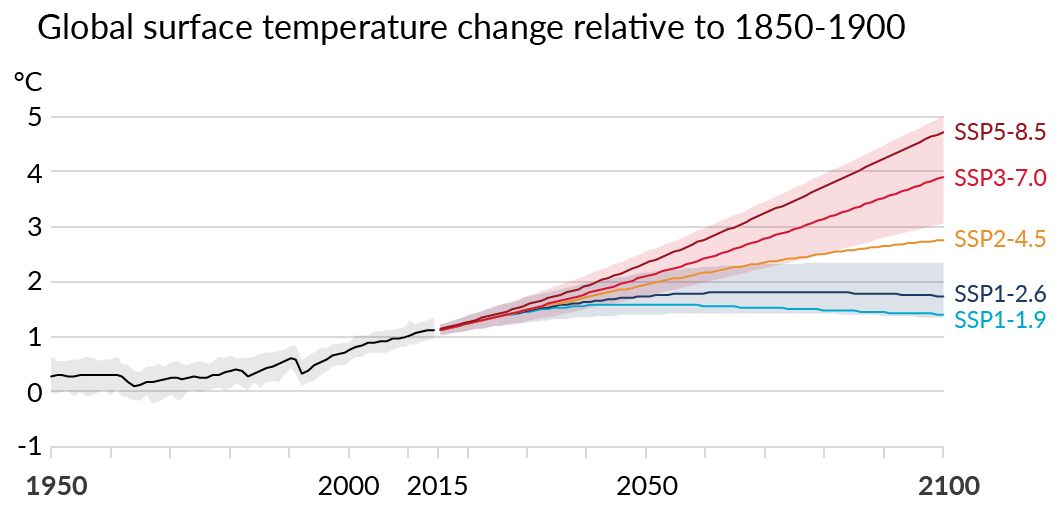
Erhöhung der globalen Mitteltemperatur 1950 bis 2100; bis 2015 nach Beobachtungen, danach nach verschiedenen SSP-Szenarien
Lizenzhinweis
|
Quelle: IPCC (2021): Summary for Policymakers, In: Climate Change 2021, Working Group I: The Physical Science Basis, Figure SPM8 |
Dateiversionen
Klicken Sie auf einen Zeitpunkt, um diese Version zu laden.
| Version vom | Vorschaubild | Maße | Benutzer | Kommentar | |
|---|---|---|---|---|---|
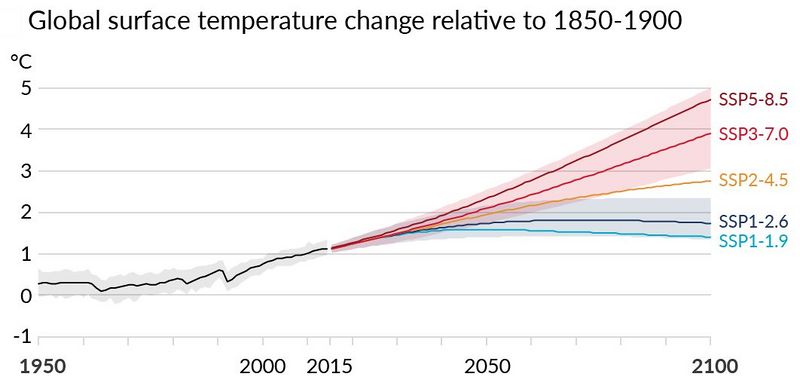
| aktuell | 17:11, 21. Aug. 2021 | | 1.062 × 516 (46 KB) | Dieter Kasang (Diskussion | Beiträge) | == Beschreibung == Erhöhung der globalen Mitteltemperatur 1850-1900 bis 2041-2060 und 2081-2100 nach verschiedenen SSP-Szenarien == Lizenzhinweis == {| style="border:1px solid #8888aa; background-color:#f7f8ff;padding:5px;font-size:95%;" | Quelle: eigene Darstellung (D. Kasang), Daten nach IPCC (2021): Climate Change 2021, Working Group I: The Science of Climate Change, Table 4.2<br> Lizenz: CC BY-SA |} |
Sie können diese Datei nicht überschreiben.
Dateiverwendung
Die folgenden 2 Seiten verwenden diese Datei: