Datei:Eisschild Feedbacks.jpg
Originaldatei (866 × 669 Pixel, Dateigröße: 79 KB, MIME-Typ: image/jpeg)
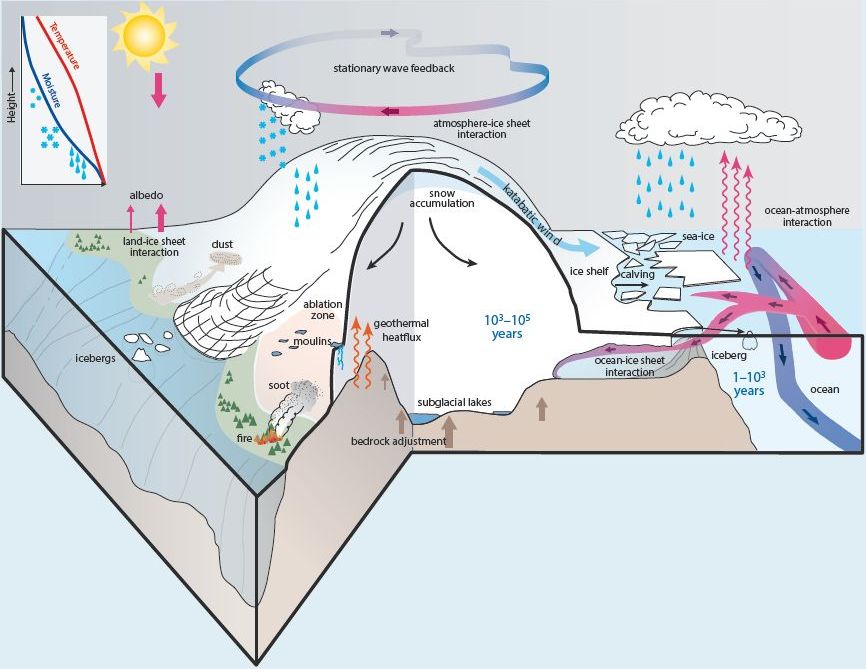
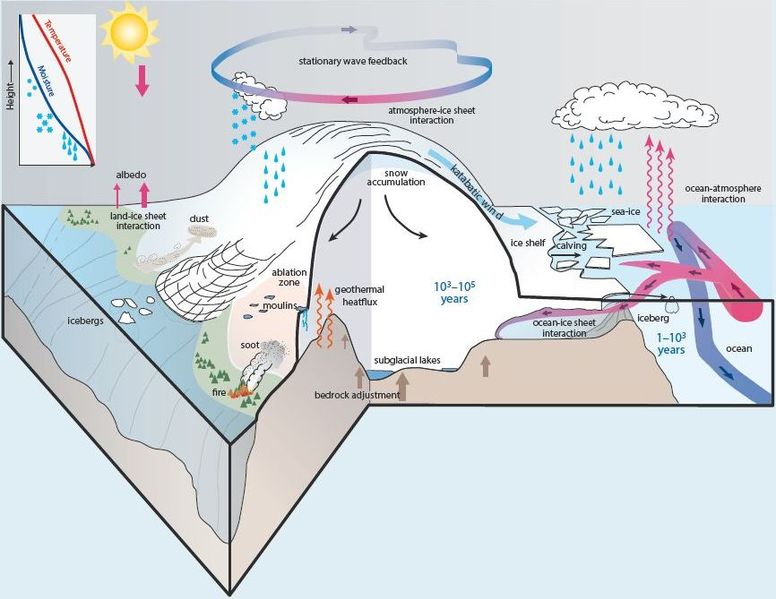
Schematische Darstellung der vielfältigen Feedback-Prozesse zwischen einem Eisschild, der Erdkruste und dem Klimasystem. Die eingefügte Zeichnung oben links zeigt ein typisches Profil von Temperatur und Luftfeuchtigkeit in der Troposphäre über dem Eisschild.
Lizenzhinweis
| Quelle: IPCC (2013): Climate Change 2014, Working Group I: The Science of Climate Change, Box 5.2, Figure 1
IPCC-Lizenz: Reproduction of limited number of figures or short excerpts of IPCC material is authorized free of charge and without formal written permission provided that the original source is properly acknowledged, with mention of the complete name of the report, the publisher and the numbering of the page(s) or the figure(s). Permission can only be granted to use the material exactly as it is in the report. Please be aware that figures cannot be altered in any way, including the full legend. |
Dateiversionen
Klicken Sie auf einen Zeitpunkt, um diese Version zu laden.
| Version vom | Vorschaubild | Maße | Benutzer | Kommentar | |
|---|---|---|---|---|---|
| aktuell | 15:13, 27. Dez. 2017 | | 866 × 669 (79 KB) | Dieter Kasang (Diskussion | Beiträge) | Aufbau und Feeback-Prozesse eines Eisschildes. ==Lizenzhinweis== {| style="border:1px solid #8888aa; background-color:#f7f8ff;padding:5px;font-size:95%;" |Quelle: IPCC (2013): Climate Change 2014, Working Group I: The Science of Climate Change, Box 5… |
Sie können diese Datei nicht überschreiben.
Dateiverwendung
Die folgende Seite verwendet diese Datei: