Datei:The top five producers by crop as of 2014..PNG
Aus Klimawandel

Größe dieser Vorschau: 800 × 411 Pixel. Weitere Auflösung: 2.250 × 1.156 Pixel.
Originaldatei (2.250 × 1.156 Pixel, Dateigröße: 180 KB, MIME-Typ: image/png)
Beschreibung
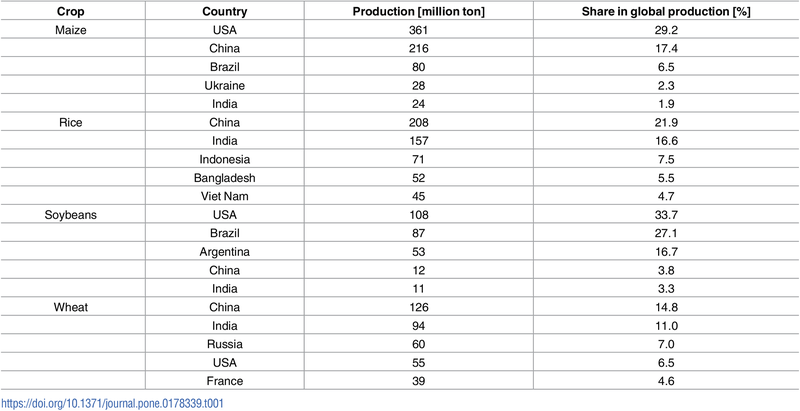
Top 5 Produktionsländer nach Nutzpflanze 2014.
Lizenzhinweis
| : : Matiu M, Ankerst DP, Menzel A (2017): CInteractions between temperature and drought in global and regional crop yield variability during 1961-2014. PLoS ONE 12(5) Lizenz CC BY 4.0 |
Dateiversionen
Klicken Sie auf einen Zeitpunkt, um diese Version zu laden.
| Version vom | Vorschaubild | Maße | Benutzer | Kommentar | |
|---|---|---|---|---|---|
| aktuell | 15:22, 3. Dez. 2020 | | 2.250 × 1.156 (180 KB) | Kklara (Diskussion | Beiträge) | == Beschreibung == Top 5 Produktionsländer nach Nutzpflanze. == Lizenzhinweis == {| style="border:1px solid #8888aa; background-color:#f7f8ff;padding:5px;font-size:95%;" | : : Matiu M, Ankerst DP, Menzel A (2017): [https://journals.plos.org/plosone/article?id=10.1371/journal.pone.0178339 CInteractions between temperature and drought in global and regional crop yield variability during 1961-2014. PLoS ONE 12(5)]<br> Lizenz [https://creativecommons.org/licenses/by-nc/4.0/ CC BY 4.0] |} |
Sie können diese Datei nicht überschreiben.
Dateiverwendung
Die folgende Seite verwendet diese Datei: