Datei:THG-Konzentration 2022.jpg: Unterschied zwischen den Versionen
Aus Klimawandel
(== Beschreibung == Mittlere Treibhausgasemissionen 2000-2009, 2012-2021 und 2021 in Gt CO<sub>2</sub>-Äquivalent ==Lizenzhinweis== {| style="border:1px solid #8888aa; background-color:#f7f8ff;padding:5px;font-size:95%;" | Quelle: Forster, P. M., C.J. Smith, T. Walsh et al. (2023): Indicators of Global Climate Change 2022: Annual update of large-scale indicators of the state of the climate system and the human influence, Earth System Science Data, doi.org/10.5194/essd-2023-166<br> Lizenz: [h…) |
K (→Beschreibung) |
||
| Zeile 1: | Zeile 1: | ||
== Beschreibung == | == Beschreibung == | ||
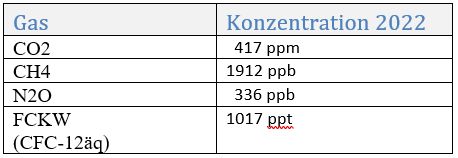
Treibhausgas-Konzentration 2022 | |||
==Lizenzhinweis== | ==Lizenzhinweis== | ||
Aktuelle Version vom 26. Juni 2023, 16:52 Uhr
Beschreibung
Treibhausgas-Konzentration 2022
Lizenzhinweis
|
Quelle: Forster, P. M., C.J. Smith, T. Walsh et al. (2023): Indicators of Global Climate Change 2022: Annual update of large-scale indicators of the state of the climate system and the human influence, Earth System Science Data, doi.org/10.5194/essd-2023-166 |
Dateiversionen
Klicken Sie auf einen Zeitpunkt, um diese Version zu laden.
| Version vom | Vorschaubild | Maße | Benutzer | Kommentar | |
|---|---|---|---|---|---|
| aktuell | 16:50, 26. Jun. 2023 | 458 × 158 (13 KB) | Dieter Kasang (Diskussion | Beiträge) | == Beschreibung == Mittlere Treibhausgasemissionen 2000-2009, 2012-2021 und 2021 in Gt CO<sub>2</sub>-Äquivalent ==Lizenzhinweis== {| style="border:1px solid #8888aa; background-color:#f7f8ff;padding:5px;font-size:95%;" | Quelle: Forster, P. M., C.J. Smith, T. Walsh et al. (2023): Indicators of Global Climate Change 2022: Annual update of large-scale indicators of the state of the climate system and the human influence, Earth System Science Data, doi.org/10.5194/essd-2023-166<br> Lizenz: [h… |
Sie können diese Datei nicht überschreiben.
Dateiverwendung
Die folgende Seite verwendet diese Datei: