Datei:SO4-trends2000-2014.jpg: Unterschied zwischen den Versionen
Aus Klimawandel
(== Beschreibung == Änderung der Sulfataerosol-Konzentration 2000-2015 in % ==Lizenzhinweis== {| style="border:1px solid #8888aa; background-color:#f7f8ff;padding:5px;font-size:95%;" | Quelle: Mortier, A., J. Gliß, J., M. Schulz et al. (2020): Evaluation of climate model aerosol trends with ground-based observations over the last 2 decades – an AeroCom and CMIP6 analysis, Atmos. Chem. Phys., 20, 13355–13378, https://doi.org/10.5194/acp-20-13355-2020<br /> Lizenz: [https://creativecommons.org/lic…) |
KKeine Bearbeitungszusammenfassung |
||
| Zeile 4: | Zeile 4: | ||
{| style="border:1px solid #8888aa; background-color:#f7f8ff;padding:5px;font-size:95%;" | {| style="border:1px solid #8888aa; background-color:#f7f8ff;padding:5px;font-size:95%;" | ||
| | | | ||
Quelle: Mortier, A., J. Gliß, J., M. Schulz et al. (2020): Evaluation of climate model aerosol trends with ground-based observations over the last 2 decades – an AeroCom and CMIP6 analysis, Atmos. Chem. Phys., 20, 13355–13378 | Quelle: Mortier, A., J. Gliß, J., M. Schulz et al. (2020): [https://doi.org/10.5194/acp-20-13355-2020 Evaluation of climate model aerosol trends with ground-based observations over the last 2 decades – an AeroCom and CMIP6 analysis], Atmos. Chem. Phys., 20, 13355–13378<br /> | ||
Lizenz: [https://creativecommons.org/licenses/by/4.0/deed.de CC BY] | Lizenz: [https://creativecommons.org/licenses/by/4.0/deed.de CC BY] | ||
| | | | ||
|} | |} | ||
Aktuelle Version vom 4. Mai 2023, 12:07 Uhr
Beschreibung
Änderung der Sulfataerosol-Konzentration 2000-2015 in %
Lizenzhinweis
|
Quelle: Mortier, A., J. Gliß, J., M. Schulz et al. (2020): Evaluation of climate model aerosol trends with ground-based observations over the last 2 decades – an AeroCom and CMIP6 analysis, Atmos. Chem. Phys., 20, 13355–13378 |
Dateiversionen
Klicken Sie auf einen Zeitpunkt, um diese Version zu laden.
| Version vom | Vorschaubild | Maße | Benutzer | Kommentar | |
|---|---|---|---|---|---|
| aktuell | 12:06, 4. Mai 2023 | 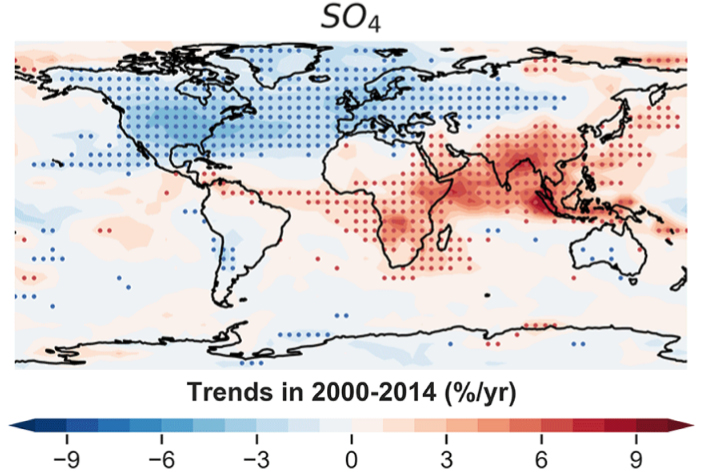 | 702 × 475 (205 KB) | Dieter Kasang (Diskussion | Beiträge) | == Beschreibung == Änderung der Sulfataerosol-Konzentration 2000-2015 in % ==Lizenzhinweis== {| style="border:1px solid #8888aa; background-color:#f7f8ff;padding:5px;font-size:95%;" | Quelle: Mortier, A., J. Gliß, J., M. Schulz et al. (2020): Evaluation of climate model aerosol trends with ground-based observations over the last 2 decades – an AeroCom and CMIP6 analysis, Atmos. Chem. Phys., 20, 13355–13378, https://doi.org/10.5194/acp-20-13355-2020<br /> Lizenz: [https://creativecommons.org/lic… |
Sie können diese Datei nicht überschreiben.
Dateiverwendung
Die folgende Seite verwendet diese Datei: