Von Dieter Kasang hochgeladene Dateien
Aus Klimawandel
Diese Spezialseite listet alle hochgeladenen Dateien auf.
| Datum | Name | Vorschaubild | Größe | Beschreibung | Versionen |
|---|---|---|---|---|---|
| 13:36, 19. Apr. 2025 | Feedback-agriculture dt.jpg (Datei) |  |
52 KB | == Beschreibung == Feedback-Mechanismen zwischen landwirtschaftlichen Aktivitäten und Klimawandel ==Lizenzhinweis== {| style="border:1px solid #8888aa; background-color:#f7f8ff;padding:5px;font-size:95%;" | Quelle: Yuan, X., Li, S., Chen, J., Yu, H., Yang, T., Wang, C., Huang, S., Chen, H., & Ao, X. (2024). Impacts of Global Climate Change on Agricultural Production: A Comprehensive Review. Agronomy, 14(7), 1360. https://doi.org/10.3390/agronomy14071360 <br> Lizenz: Lizenz: CC BY https://cr… | 1 |
| 11:41, 19. Apr. 2025 | GHG-landw-Produkte-dt.jpg (Datei) |  |
52 KB | 2 | |
| 15:50, 17. Apr. 2025 | Klima-Produktionsbedingunge.jpg (Datei) |  |
91 KB | == Beschreibung == Verlust geeigneter Klimabedingungen bei verschiedenen Erwärmungsniveaus ==Lizenzhinweis== {| style="border:1px solid #8888aa; background-color:#f7f8ff;padding:5px;font-size:95%;" | Quelle: Heikonen, S., M. Heino, M. Jalava et al. (2025): [https://doi.org/10.1038/s43016-025-01135-w Climate change threatens crop diversity at low latitudes]. Nat Food<br /> Lizenz: [http://creativecommons.org/licenses/by/4.0/ CC BY] |} | 1 |
| 14:59, 17. Apr. 2025 | Sonnenblumen Dürre EU.jpg (Datei) |  |
148 KB | == Beschreibung == Sonnenblumenfeld bei starker Dürre ==Lizenzhinweis== {| style="border:1px solid #8888aa; background-color:#f7f8ff;padding:5px;font-size:95%;" | Quelle: The Joint Research Centre: EU Science Hub (2025): AI tool to help detect growing climate hazards for EU agriculture, https://joint-research-centre.ec.europa.eu/jrc-news-and-updates/ai-tool-help-detect-growing-climate-hazards-eu-agriculture-2025-04-07_en<br /> Lizenz: [http://creativecommons.org/licenses/by/4.0/ CC BY] |} | 1 |
| 14:51, 17. Apr. 2025 | Verlust Klimabedingungen.jpg (Datei) |  |
56 KB | == Beschreibung == Verlust geeigneter Klimabedingungen bei verschiedenen Erwärmungsniveaus ==Lizenzhinweis== {| style="border:1px solid #8888aa; background-color:#f7f8ff;padding:5px;font-size:95%;" | Quelle: Heikonen, S., M. Heino, M. Jalava et al. (2025): Climate change threatens crop diversity at low latitudes. Nat Food, https://doi.org/10.1038/s43016-025-01135-w<br /> Lizenz: [http://creativecommons.org/licenses/by/4.0/ CC BY] |} | 1 |
| 20:32, 16. Apr. 2025 | France fire-wether-index2008-2017.jpg (Datei) |  |
18 KB | == Beschreibung == Beobachteter Feuer-Wetter-Index (Temperatur, Feuchtigkeit, Wind, Niederschlag) in Frankreich 2008-2017 == Lizenzhinweis == {| style="border:1px solid #8888aa; background-color:#f7f8ff;padding:5px;font-size:95%;" |Quelle: Barbero, R., J.T. Abatzoglou, F. Pimont, J. Ruffault and T. Curt (2020): Attributing Increases in Fire Weather to Anthropogenic Climate Change Over France. Front. Earth Sci. 8:104. doi: 10.3389/feart.2020.00104<br> Lizenz: CC BY http://creativecommons.org/lic… | 1 |
| 20:24, 16. Apr. 2025 | Wildfire Portugal Spt 2024.jpg (Datei) |  |
232 KB | Waldbrände im Norden Portugals im September 2024, Sattenlitenbild == Lizenzhinweis == {| style="border:1px solid #8888aa; background-color:#f7f8ff;padding:5px;font-size:95%;" |Quelle: WWikimedia Commons (2024): Spurred by a combination of high temperatures, low humidity, and dry vegetation, a severe wildfire outbreak struck Portugal in mid-September 2024, https://commons.wikimedia.org/wiki/File:Fires_Blaze_across_Portugal_(MODIS_2024-09-19).jpg , ursprgl. NASA. Lizenz: public domainge |} | 1 |
| 19:32, 16. Apr. 2025 | Grundwasserressourcen Eu.jpg (Datei) |  |
769 KB | == Beschreibung == Grundwasserressourcen in Europa ==Lizenzhinweis== {| style="border:1px solid #8888aa; background-color:#f7f8ff;padding:5px;font-size:95%;" | Quelle: Bundesanstalt für Geowissenschaften und Rohstoffe (BGR): Additional Maps, https://www.whymap.org/whymap/EN/Maps_Data/Additional_maps/addimaps_node_en.html <br> Lizenz: This information may be freely used and copied for educational and other non-commercial purposes, provided that any reproduction of data be accompanied by an ack… | 1 |
| 16:43, 15. Apr. 2025 | Hitze-Dürretage-Weizen.jpg (Datei) |  |
55 KB | == Beschreibung == Die Häufigkeit von Hitze- und Dürreextremen in Weizenanbaugebieten während der Wachstumszeit 2081-2100 nach dem Szenario SSP2-4.5 in Tagen pro Jahr ==Lizenzhinweis== {| style="border:1px solid #8888aa; background-color:#f7f8ff;padding:5px;font-size:95%;" | Quelle: He, Y., Y. Zhao, S. Sun et al. (2024): Global warming determines future increase in compound dry and hot days within wheat growing seasons worldwide. Climatic Change 177, 70 (2024). https://doi.org/10.1007/s10584-02… | 1 |
| 16:35, 15. Apr. 2025 | Surface moisture 2100.jpg (Datei) |  |
128 KB | == Beschreibung == Änderung der Bodenfeuchte durch höhere Temperaturen und Verdunstung bis 2086-2100 im Vergleich zu 1982-1996 in % ==Lizenzhinweis== {| style="border:1px solid #8888aa; background-color:#f7f8ff;padding:5px;font-size:95%;" | Quelle: Chen, Z., W. Wang, G. Forzieri et al. (2024): Transition from positive to negative indirect CO2 effects on the vegetation carbon uptake. Nat Commun 15, 1500 (2024). https://doi.org/10.1038/s41467-024-45957-x <br> Lizenz: CC BY |} | 1 |
| 16:15, 15. Apr. 2025 | Change C-uptake 2100.jpg (Datei) |  |
133 KB | == Beschreibung == Änderung der Kohlenstoffaufnahme durch die indirekte bzw. klimatische Wirkung der CO2-Zunahme in der Atmosphäre bis 2086-2100 im Vergleich zu 1982-1996 ==Lizenzhinweis== {| style="border:1px solid #8888aa; background-color:#f7f8ff;padding:5px;font-size:95%;" | Quelle: Chen, Z., W. Wang, G. Forzieri et al. (2024): Transition from positive to negative indirect CO2 effects on the vegetation carbon uptake. Nat Commun 15, 1500 (2024). https://doi.org/10.1038/s41467-024-45957-x… | 1 |
| 20:29, 8. Apr. 2025 | Wald in ackerland.jpg (Datei) |  |
96 KB | 2 | |
| 18:05, 8. Apr. 2025 | GHG landw Produkte.jpg (Datei) |  |
45 KB | == Beschreibung == Treibhausgasemissionen pro kg landwirtschaftlicher Produkte ==Lizenzhinweis== {| style="border:1px solid #8888aa; background-color:#f7f8ff;padding:5px;font-size:95%;" | Quelle:FAO. 2024. World Food and Agriculture – Statistical Yearbook 2024. Rome. https://doi.org/10.4060/cd2971en, Lizenz: [https://creativecommons.org/licenses/by/4.0/legalcode.e CC BY]<br> |} | 1 |
| 18:00, 8. Apr. 2025 | GHG-emissions-AFOLU-dt.jpg (Datei) |  |
95 KB | == Beschreibung == Globale Treibhausgasemissionen aus der landwirtschaftlichen Produktion sowie vor- und nachgelagerte Aktivitäten (z.B. Futtermittel- und Saatgutherstellung bzw. Transport und Vermarktung) ==Lizenzhinweis== {| style="border:1px solid #8888aa; background-color:#f7f8ff;padding:5px;font-size:95%;" | Quelle:FAO. 2024. World Food and Agriculture – Statistical Yearbook 2024. Rome. https://doi.org/10.4060/cd2971en, Lizenz: CC BY https://creativecommons.org/licenses/by/4.0/legalcode.e… | 1 |
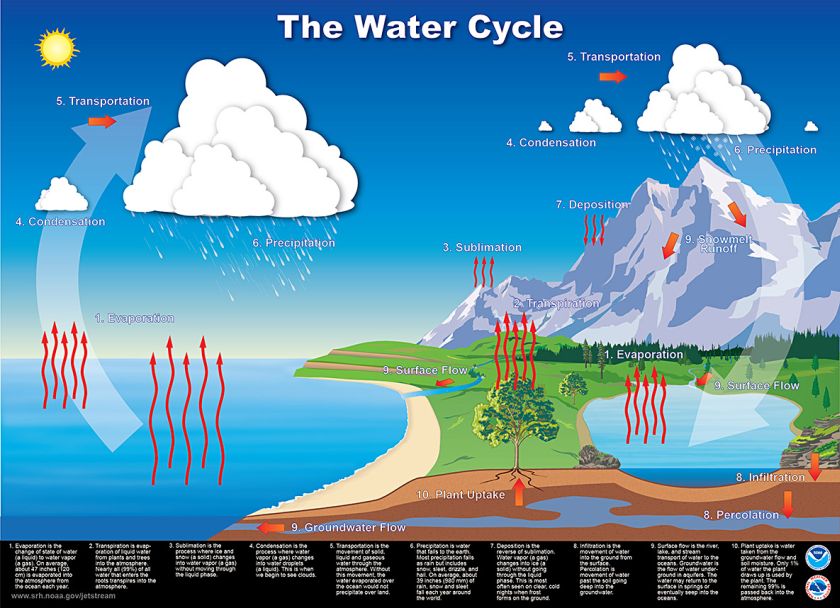
| 17:57, 4. Apr. 2025 | Water cycle NOAA.jpg (Datei) |  |
201 KB | 2 | |
| 17:03, 4. Apr. 2025 | Meeresspiegelanstieg Zeitskalen.png (Datei) |  |
62 KB | == Beschreibung == Meeresspiegelanstieg bei Erwärmung ==Lizenzhinweis== {| style="border:1px solid #8888aa; background-color:#f7f8ff;padding:5px;font-size:95%;" | Quelle: NASA ClimateKids (2025): How Does Climate Change Affect the Ocean?, https://climatekids.nasa.gov/ocean/<br> Lizenz: public domain |} | 1 |
| 16:59, 4. Apr. 2025 | Sea-levels-are-rising.png (Datei) |  |
22 KB | == Beschreibung == Meeresspiegelanstieg bei Erwärmung ==Lizenzhinweis== {| style="border:1px solid #8888aa; background-color:#f7f8ff;padding:5px;font-size:95%;" | Quelle: NASA ClimateKids (2025): How Does Climate Change Affect the Ocean?, https://climatekids.nasa.gov/ocean/<br> Lizenz: public domain |} | 1 |
| 16:53, 4. Apr. 2025 | Fidschi Umsiedlung.jpg (Datei) |  |
103 KB | == Beschreibung == Vorsorgliche Umsiedlung auf den Fidschi-Inseln: Von 42 Dörfern sind 6 bereits umgesiedelt worden. ==Lizenzhinweis== {| style="border:1px solid #8888aa; background-color:#f7f8ff;padding:5px;font-size:95%;" | Quelle: United Nations Office for Disaster Risk Reduction (2023): GAR Special Report: Measuring Resilience for the Sustainable Development Goals. Geneva. http://www.undrr.org/gar2023sr<br> Lizenz: CC BY-NC IGO, http://creativecommons.org/licenses/by-nc/3.0/igo/legalcode… | 1 |
| 12:02, 31. Mär. 2025 | Ozone Atmosphere.png (Datei) |  |
325 KB | == Beschreibung == Ozon in der Atmosphäre ==Lizenzhinweis== {| style="border:1px solid #8888aa; background-color:#f7f8ff;padding:5px;font-size:95%;" | Quelle: WMO (2022): Twenty Questions and Answers About the Ozone Layer: 2022 Update, Scientific Assessment of Ozone Depletion, https://www.csl.noaa.gov/assessments/ozone/2022 <br> Lizenz: public domain |} | 1 |
| 13:30, 27. Mär. 2025 | Ocean C-Storage dt.jpg (Datei) |  |
79 KB | Aufnahme, chemische Umwandlung und Speicherung von Kohlenstoff im Ozean. Der Ozean nimmt CO<sub>2</sub> aus der Atmosphäre auf, das sich mit Wasser (H<sub>2</sub>O) zu Kohlensäure (H<sub>2</sub>CO<sub>3</sub>) verbindet. Daraus entstehen außerdem Wasserstoff-Ionen (H<sup>+</sup>) und Hydrogencarbonat (HCO<sub>3</sub>). Die Wasserstoff-Ionen verbinden sich mit Karbonat-Ionen (CO<sub>3</sub><sup>2-</sup>) und reduzieren damit die Möglichkeit zur Bildung von Kalziumkarbonat (CaCO<sub>3</sub>), de… | 1 |
| 13:14, 27. Mär. 2025 | CO2 2000years.gif (Datei) |  |
44 KB | == Beschreibung == Die atmosphärische CO2-Konzentration in den letzten 2000 Jahren ==Lizenzhinweis== {| style="border:1px solid #8888aa; background-color:#f7f8ff;padding:5px;font-size:95%;" | Quelle: Ritchie, H., and M. Roser – Our World in Data (2020): Atmospheric concentrations, https://ourworldindata.org/atmospheric-concentrations<br> Lizenz: [https://creativecommons.org/licenses/by/4.0/ CC BY] |} | 1 |
| 13:09, 27. Mär. 2025 | 10.000 Years of CO2.png (Datei) |  |
208 KB | == Beschreibung == Der Kohlendioxidgehalt der Atmosphäre in den letzten 10.000 Jahren ==Lizenzhinweis== {| style="border:1px solid #8888aa; background-color:#f7f8ff;padding:5px;font-size:95%;" | Quelle: Berkeley Earth (2022): 10,000 Years of Carbon Dioxide, https://berkeleyearth.org/dv/10000-years-of-carbon-dioxide/ <br> Lizenz: [https://creativecommons.org/licenses/by/4.0/ CC BY] |} | 1 |
| 13:03, 27. Mär. 2025 | CO2 10.000 years.jpg (Datei) |  |
24 KB | == Beschreibung == CO2-Gehalt der Atmosphäre in den letzten 10.000 Jahren ==Lizenzhinweis== {| style="border:1px solid #8888aa; background-color:#f7f8ff;padding:5px;font-size:95%;" | Quelle: Esper, J., P. Schulz & U. Büntgen (2024): Is Recent Warming Exceeding the Range of the Past 125,000 Years? Atmosphere 15, no. 4: 405. https://doi.org/10.3390/atmos15040405<br> Lizenz: [https://creativecommons.org/licenses/by/4.0/ CC BY] |} | 1 |
| 16:33, 24. Mär. 2025 | Ocean-CO2-uptake-dt.jpg (Datei) |  |
99 KB | == Beschreibung == Aufnahme von anthropogenem CO2 in der Deckschicht des Ozeans ==Lizenzhinweis== {| style="border:1px solid #8888aa; background-color:#f7f8ff;padding:5px;font-size:95%;" | Quelle:NOAA PMEL Carbon Program: How the oceans absorb carbon dioxide is critical for predicting climate change, https://www.pmel.noaa.gov/co2/story/Ocean%2BCarbon%2BUptake<br> Lizenz: public domain |} | 1 |
| 14:28, 23. Mär. 2025 | CO2 Kreislauf ozean.jpg (Datei) |  |
54 KB | Der ozeanische Kohlenstoffkreislauf. Physikalische und chemische Prozesse sind rot, biologische Prozesse grün dargestellt. == Lizenzhinweis == {| style="border:1px solid #8888aa; background-color:#f7f8ff;padding:5px;font-size:95%;" |Eigene Darstellung nach IPCC (2001): Climate Change 2001: The Sientific Basis. Contribution of the Working Group I to the Third Assessment Report of the Intergovernmental Panel on Climate Change, Cambridge and New York 2001, Figure 3.1 |} | 1 |
| 19:06, 18. Mär. 2025 | Wirkung-Klimawandel-CO2-Flüsse.jpg (Datei) |  |
106 KB | == Beschreibung == Auswirkungen der globalen Erwärmung auf die CO2-Flüsse. Grün-blau: CO2-Senke in KgC pro m2 und Jahr; gelb-rot: CO2-Quelle in KgC pro m2 und Jahr. ==Lizenzhinweis== {| style="border:1px solid #8888aa; background-color:#f7f8ff;padding:5px;font-size:95%;" | Quelle: Friedlingstein, P., M. O'Sullivan, M.W. Jones et al. (2025): [https://doi.org/10.5194/essd-17-965-2025 Global Carbon Budget 2024], Earth Syst. Sci. Data, 17, 965–1039 <br> Lizenz: Lizenz: [https://creativecommons.org/… | 1 |
| 19:01, 18. Mär. 2025 | CO2-Düngungseffekt.jpg (Datei) |  |
99 KB | 2 | |
| 18:46, 18. Mär. 2025 | CO2-Land-Senke.jpg (Datei) |  |
109 KB | == Beschreibung == CO2-Quellen und Senken auf dem Land. Grün-blau: CO2-Senke in KgC pro m2 und Jahr; gelb-rot: CO2-Quelle in KgC pro m2 und Jahr. ==Lizenzhinweis== {| style="border:1px solid #8888aa; background-color:#f7f8ff;padding:5px;font-size:95%;" | Quelle: Friedlingstein, P., M. O'Sullivan, M.W. Jones et al. (2025): Global Carbon Budget 2024, Earth Syst. Sci. Data, 17, 965–1039, https://doi.org/10.5194/essd-17-965-2025 <br> Lizenz: Lizenz: [https://creativecommons.org/licenses/by/4.0/ CC… | 1 |
| 19:21, 11. Mär. 2025 | Grundwasser.png (Datei) |  |
68 KB | == Beschreibung == Grundwsser (dt.) ==Lizenzhinweis== {| style="border:1px solid #8888aa; background-color:#f7f8ff;padding:5px;font-size:95%;" | Quelle: NASA ClimateKids (2025): What Is Groundwater?, https://climatekids.nasa.gov/groundwater/ Lizenz: public domain <br> Lizenz: public domain |} | 1 |
| 18:10, 11. Mär. 2025 | Globaler wasser kreislauf.jpg (Datei) |  |
356 KB | Globale Wasserflüsse in 1000 km3 pro Jahr (mit Angaben zur Unsicherheit der Schätzungen in %) ==Lizenzhinweis== {| style="border:1px solid #8888aa; background-color:#f7f8ff;padding:5px;font-size:95%;" | Quelle: Allan, R.P. et al. (2020): Advances in understanding large-scale responses of the water cycle to climate change. Annals 21 of the New York Academy of Sciences, 1–27, doi:10.1111/nyas.14337<br> Lizenz: CC BY http://creativecommons.org/licenses/by/4.0/ |} | 1 |
| 11:55, 10. Mär. 2025 | C-Speicherung Wald.jpg (Datei) |  |
80 KB | == Beschreibung == Der globale Kohlenstoffkreislauf und die anthropogenen Störungen ==Lizenzhinweis== {| style="border:1px solid #8888aa; background-color:#f7f8ff;padding:5px;font-size:95%;" | Quelle:Office for Climate Education (2024, dt. Version): [https://www.oce.global/de/resources/aktivitaeten-fuer-die-klasse/das-klima-unseren-haenden-klimawandel-und-landsysteme Das Klima in unseren Händen – Klimawandel und Landsysteme, Lehrerhandbuch für die Klassenstufen 5 bis 10]<br> Lizenz: CC BY-NC-SA… | 1 |
| 11:46, 10. Mär. 2025 | Kohlenstoffkreislauf OCE.jpg (Datei) |  |
111 KB | == Beschreibung == Der globale Kohlenstoffkreislauf und die anthropogenen Störungen ==Lizenzhinweis== {| style="border:1px solid #8888aa; background-color:#f7f8ff;padding:5px;font-size:95%;" | Quelle:Office for Climate Education (2024, dt. Version): [https://www.oce.global/de/resources/aktivitaeten-fuer-die-klasse/das-klima-unseren-haenden-klimawandel-und-landsysteme Das Klima in unseren Händen – Klimawandel und Landsysteme, Lehrerhandbuch für die Klassenstufen 5 bis 10]<br> Lizenz: CC BY-NC-SA… | 1 |
| 11:37, 10. Mär. 2025 | Sonnenenergie Klimasystem.jpg (Datei) |  |
68 KB | == Beschreibung == Die Energie der Sonne ist der Hauptantrieb des Klimasystems. ==Lizenzhinweis== {| style="border:1px solid #8888aa; background-color:#f7f8ff;padding:5px;font-size:95%;" | Quelle:Office for Climate Education (2024, dt. Version): [https://www.oce.global/de/resources/aktivitaeten-fuer-die-klasse/das-klima-unseren-haenden-klimawandel-und-landsysteme Das Klima in unseren Händen – Klimawandel und Landsysteme, Lehrerhandbuch für die Klassenstufen 5 bis 10]<br> Lizenz: CC BY-NC-SA |} | 1 |
| 11:27, 10. Mär. 2025 | Wiederkäuer Methan.jpg (Datei) |  |
107 KB | == Beschreibung == Wiederkäuer und ihr Methanausstoß ==Lizenzhinweis== {| style="border:1px solid #8888aa; background-color:#f7f8ff;padding:5px;font-size:95%;" | Quelle:Office for Climate Education (2024, dt. Version): Das Klima in unseren Händen – Klimawandel und Landsysteme, Lehrerhandbuch für die Klassenstufen 5 bis 10, https://www.oce.global/de/resources/aktivitaeten-fuer-die-klasse/das-klima-unseren-haenden-klimawandel-und-landsysteme<br> Lizenz: CC BY-NC-SA |} | 1 |
| 12:52, 8. Mär. 2025 | Carbon-cycle.png (Datei) |  |
52 KB | 2 | |
| 12:07, 8. Mär. 2025 | Fossil-fuels.png (Datei) |  |
10 KB | == Beschreibung == Verbrennung fossiler Energierohstoffe als CO2-Quelle ==Lizenzhinweis== {| style="border:1px solid #8888aa; background-color:#f7f8ff;padding:5px;font-size:95%;" | Quelle: NASA ClimateKids (2025): A Guide to Climate Change for Kids, https://climatekids.nasa.gov/kids-guide-to-climate-change/ <br> Lizenz: public domain |} | 1 |
| 11:58, 8. Mär. 2025 | Carbon-dioxide.png (Datei) |  |
9 KB | == Beschreibung == Das Kohlendioxidmolekül (CO2) besteht aus zwei Sauerstoff- und ein Kohlenstoffatom. ==Lizenzhinweis== {| style="border:1px solid #8888aa; background-color:#f7f8ff;padding:5px;font-size:95%;" | Quelle: NASA ClimateKids (2005): Why Is Carbon Importent? https://climatekids.nasa.gov/carbon/ <br> Lizenz: public domain |} | 1 |
| 22:20, 7. Mär. 2025 | Eis-Albedo-Feedback.jpg (Datei) |  |
117 KB | 2 | |
| 22:08, 7. Mär. 2025 | Greenhouse-effect-diagram.jpg (Datei) |  |
22 KB | == Beschreibung == Die Erdatmosphäre fängt die Wärme der Sonneneinstrahlung ein. == Lizenzhinweis == {| style="border:1px solid #8888aa; background-color:#f7f8ff;padding:5px;font-size:95%;" |Quelle: NASA ClimateKids (2025): What is the Greenhouse Effect? https://climatekids.nasa.gov/greenhouse-effect/<br> Lizenz: public domain |} | 1 |
| 22:05, 7. Mär. 2025 | Greenhouse-traps-heat.jpg (Datei) |  |
19 KB | == Beschreibung == Ein Treibhaus fängt die Wärme der Sonneneinstrahlung ein. == Lizenzhinweis == {| style="border:1px solid #8888aa; background-color:#f7f8ff;padding:5px;font-size:95%;" |Quelle: NASA ClimateKids (2025): What is the Greenhouse Effect? https://climatekids.nasa.gov/greenhouse-effect/<br> Lizenz: public domain |} | 1 |
| 21:40, 7. Mär. 2025 | Natürlicher Treibhauseffekt.png (Datei) |  |
184 KB | == Beschreibung == Der natürliche Treibhauseffekt bewirkt eine Erwärmung der Erdatmosphäre um 32 °C. == Lizenzhinweis == {| style="border:1px solid #8888aa; background-color:#f7f8ff;padding:5px;font-size:95%;" |Quelle: Schrader, C., bpb (2023): Klimawandel – die gestörte Balance, https://www.bpb.de/themen/klimawandel/dossier-klimawandel/517115/klimawandel-die-gestoerte-balance/ <br> Lizenz: CC BY-NC-ND https://creativecommons.org/licenses/by-nc-nd/4.0/deed.de |} | 1 |
| 16:48, 7. Mär. 2025 | Globale Zirkulation.png (Datei) |  |
373 KB | Globale Zirkulation der Erdatmosphäre mit Hadley-Zelle, Ferrell-Zelle und Polarzelle ==Lizenzhinweis== {| style="border:1px solid #8888aa; background-color:#f7f8ff;padding:5px;font-size:95%;" | Quelle: Wikimedia Commons (2013): Globale Zirkulation der Erdatmosphäre mit Hadley-Zelle, Ferrell-Zelle und Polarzelle, https://commons.wikimedia.org/wiki/File:Earth_Global_Circulation_-_de.svg<br> Lizenz: CC BY-SA https://creativecommons.org/licenses/by-sa/3.0/deed.en |} | 1 |
| 18:13, 5. Mär. 2025 | Amazon tipping potential.jpg (Datei) |  |
101 KB | == Beschreibung == Kipppunkte-Potential im Amazonasgebiet im Jahr 2050: -1 (blau) = gering, 2-4 (orange bis rot) = hoch bis sehr hoch. ==Lizenzhinweis== {| style="border:1px solid #8888aa; background-color:#f7f8ff;padding:5px;font-size:95%;" | Quelle: Flores, B.M., E. Montoya, B. Sakschewskiet al. (2024): Critical transitions in the Amazon forest system. Nature 626, 555–564, https://doi.org/10.1038/s41586-023-06970-0 <br> Lizenz: CC BY http://creativecommons.org/licenses/by/4.0/ |} | 1 |
| 18:06, 5. Mär. 2025 | Amazon-Wald–Vegetation.jpg (Datei) |  |
145 KB | == Beschreibung == Änderung der Wechselwirkungen von Vegetation und Atmosphäre durch Abholzung und die Folgen für den Niederschlag. ==Lizenzhinweis== {| style="border:1px solid #8888aa; background-color:#f7f8ff;padding:5px;font-size:95%;" | Quelle: Zemp, D.C., C.-F. Schleussner, H.M.J. Barbosa et al. (2017): Self-amplified Amazon forest loss due to vegetation–atmosphere feedbacks. Nat. Commun. 8, https://www.nature.com/articles/ncomms14681<br> Lizenz: [http://creativecommons.org/licenses/by/4.… | 1 |
| 18:00, 5. Mär. 2025 | Amazon-Verdunstung-Temp-Wolk.jpg (Datei) |  |
79 KB | == Beschreibung == Abnehmende Verdunstung erhöht die Temperatur, wodurch die Wolkenbedeckung abnimmt )Modellsimulation über ca. 100 Jahre). ==Lizenzhinweis== {| style="border:1px solid #8888aa; background-color:#f7f8ff;padding:5px;font-size:95%;" | Quelle: Kimm, H., S.-W. Park, S.-Y. Jun & J.-S. Kug (2024): How does plant CO2 physiological forcing amplify Amazon warming in CMIP6 Earth system models? Earth's Future, 12, e2023EF004223. Lizenz: CC BY http://creativecommons.org/licenses/by/4.0/… | 1 |
| 17:54, 5. Mär. 2025 | Temp-E-Amazon-1900-2100.jpg (Datei) | 66 KB | == Beschreibung == Wasserkreislauf im Amazonas-Regenwald ==Lizenzhinweis== {| style="border:1px solid #8888aa; background-color:#f7f8ff;padding:5px;font-size:95%;" | Quelle: Parsons, L. A. (2020). Implications of CMIP6 projected drying trends for 21st century Amazonian drought risk. Earth's Future, 8, e2020EF001608. https://doi.org/10.1029/2020EF001608<br> Lizenz: CC BY-NC-ND http://creativecommons.org/licenses/by-nc-nd/4.0/ |} | 1 | |
| 22:03, 4. Mär. 2025 | Konvektionsregen.jpg (Datei) |  |
40 KB | == Beschreibung == Konvektionsregen ==Lizenzhinweis== {| style="border:1px solid #8888aa; background-color:#f7f8ff;padding:5px;font-size:95%;" | Quelle: Wikipedia (2004): Konvektionsregen, https://commons.wikimedia.org/wiki/File:Konvektionsregen.jpg <br> Lizenz: [https://creativecommons.org/licenses/by-sa/3.0/deed.en CC BY-SA] |} | 1 |
| 21:58, 4. Mär. 2025 | Steigungsregen.jpg (Datei) |  |
26 KB | Steigungsregen ==Lizenzhinweis== {| style="border:1px solid #8888aa; background-color:#f7f8ff;padding:5px;font-size:95%;" | Quelle: Wikipedia (2005): Steigungsregen, https://commons.wikimedia.org/wiki/File:Steigungsregen.jpg<br> Lizenz: CC Y-SA https://creativecommons.org/licenses/by-sa/3.0/deed.en |} | 1 |
| 18:48, 22. Feb. 2025 | Amazonia deforestation1988-2017.jpg (Datei) |  |
112 KB | == Beschreibung == Entwaldungsrate im brasilianischen Amazonas 1988-2017 ==Lizenzhinweis== {| style="border:1px solid #8888aa; background-color:#f7f8ff;padding:5px;font-size:95%;" | Quelle: Larrea, C., Murais, T. Azevedo et al. (2021): Globalization, Extractivism and Social Exclusion: Threats and Opportunities to Amazon Governance in Brazil In: Nobre, C., A. Encalada, E. Anderson et al. (Ed.). Amazon Assessment Report 2021 II, Chapter 17<br> Lizenz: Lizenz: CC BY-NC-SA 4.0 |} | 1 |
| 13:42, 19. Feb. 2025 | Amazon prec trend 1981-2017.jpg (Datei) |  |
101 KB | == Beschreibung == Regionale Niederschlagstrends im Amazonasgebiet 1981-2017 in mm/Jahr ==Lizenzhinweis== {| style="border:1px solid #8888aa; background-color:#f7f8ff;padding:5px;font-size:95%;" | Quelle: Paca, V.H. da Motta, G.E. Espinoza-Dávalos et al. (2020): Variability of Trends in Precipitation across the Amazon River Basin Determined from the CHIRPS Precipitation Product and from Station Records, Water 12, no. 5: 1244. https://doi.org/10.3390/w12051244 <br> Lizenz: [https://creativecomm… | 1 |